What is our lead generation target? It is a question that every marketing organization needs to answer at the start of every year (if not every quarter). Determining the answer is not straightforward. There are many different inputs needed to perform the calculation. Marketers need to understand the corporate growth targets, historical conversion rates, and changing market dynamics to arrive at the right number.
In this article, we’ll outline a simple, five-step approach you can take to calculate your lead generation target.
- Bookings – Calculate the percentage of new sales that need to be sourced by marketing programs (e.g. $1M in bookings).
- Wins – Calculate the number of wins you need to hit the bookings target that are sourced by marketing (e.g. 50 wins).
- Opportunities -Determine the number of opportunities (SQLs) needed to achieve the wins (e.g. 200 opps in pipeline).
- Leads – Calculate the number of marketing-sourced leads (MQLs) needed to generate the opportunities (e.g. 400 leads).
- Inquiries – Determine the number of marketing accepted leads (MALs) needed to hit the lead target.

Step One
Bookings
What Percentage of New Sales are Sourced by Marketing?
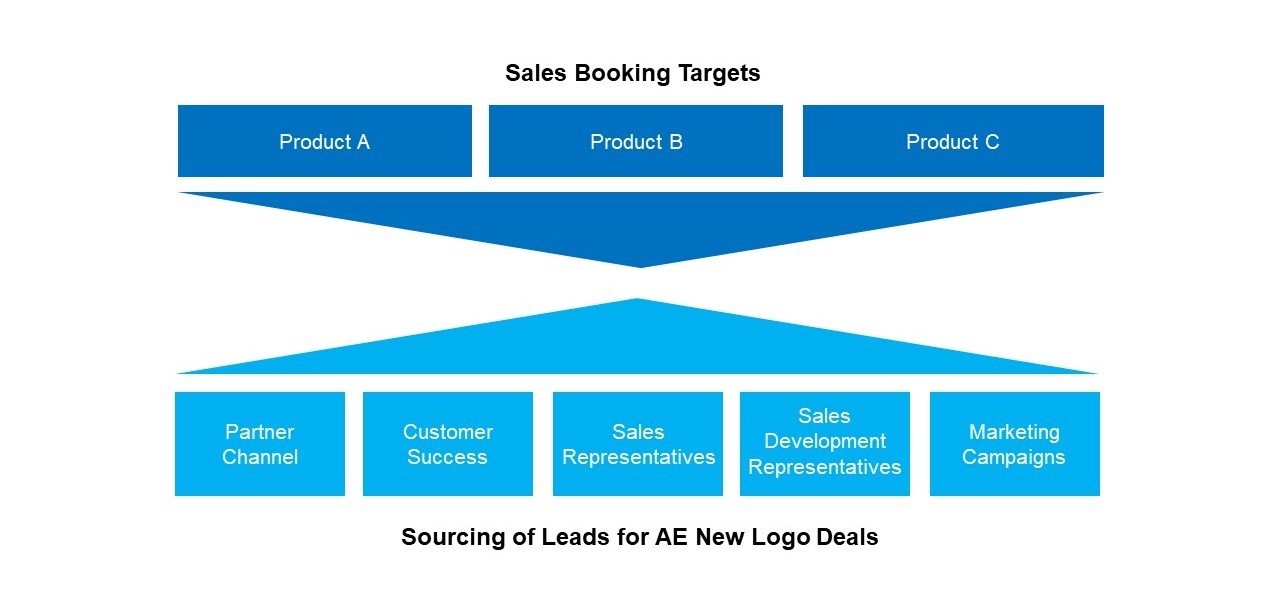
The first question that needs to be answered to determine the marketing lead target is the expected distribution of leads across the various sources. Not all leads come from marketing. At most SaaS or cloud companies, the leads come from a mix of different sources:
Distribution of Lead Sources
- Marketing Campaigns – Leads created from content downloads, web forms, search engine ads, webinar registrations, and tradeshow interactions.
- Sales Development Representatives – Leads from prospecting activities such as cold calling, emailing, and social media (LinkedIn InMails).
- Customer Success – Leads for upsell and cross-sell opportunities discovered through account management activities.
- Partner Channel – Leads generated through channel partners such as systems integrators, BPO firms, VARs, and other partners.
- Sales Representatives – Leads from networking and prospecting activities of account executives.
The mix of leads coming from different sources will vary from company-to-company. The dynamics will shift also as a company grows. At a startup, the sales representatives might be responsible for sourcing 100% of the leads. After the company gets a few rounds of funding, the company might invest in a marketing and SDR organization to perform the bulk of the demand generation. As the company gets bigger it will develop partner channels to source leads and upsell more services to its existing accounts via Customer Success.
For business planning purposes you will want to arrive at a quota or target for each of the sources in your organization. For example, a total $10M ACV quota might be distributed with $4M to SDRs, $3M to Marketing, $2M to Partners, $0.5M to Sales and $0.5M to Customer Success. However, before you can determine the specific allocations for the quota targets you will want to do more research.
Review of Historical Performance
The best place to start is to examine historical trends. Review the deals you closed over the past 6, 12, and 18 months. Where did the leads for those closed deals come from? If you cannot get the answers you are looking for in your CRM, interview the sales representatives that worked the deals to find out how they originally got into some of the opportunities. In complex business solution sales, identifying the “source” of the lead could be challenging. For “high consideration” purchases there are often multiple buyer personas engaging in different activities long before the opportunity makes its way into the sales pipeline. Do your best to identify the number of leads that came from SDRs, Marketing, Partners, Sales, and Customer Success.
Assumptions about Next Year’s Go-to-Market Model
Historical performance is not always indicative of future behaviors, especially in high-growth companies. As a result, you will then want to consider reasons why the dynamics around lead generation might change in the upcoming year:
- Are you investing in more quota-bearing reps (sales headcount)?
- Are you significantly increasing the marketing campaigns budget?
- Are you hiring more SDRs?
- Are you developing new channel partnerships?
- Is the ratio of existing customers to new logos shifting (driving more upsell/cross-sell through customer success)?
Using the historical performance as a starting point and the future assumptions you can arrive at an allocation of lead quota for each group. The process is typically more of a negotiation. Department leaders will go back and forth performing a little horse-trading to arrive at a final set of numbers.
Example
What Percentage of Sales are Sourced by Marketing?
For example, suppose that last year that the sales team sourced the leads that resulted in 70% of the wins and marketing generated the remaining 30%. However, the Chief Revenue Officer wants the sales representatives to be spending less time prospecting and more time managing deal cycles. As a result, the business is hiring three new SDRs. Additionally, a new wave of funding has been recently closed and the business will be investing to double the marketing budget year-over-year. Negotiations between the CRO and CMO, lead to marketing (including SDRs) taking responsibility for 50% of the leads.
Assume that the annual sales bookings target is $10M. To calculate Marketing-Sourced Bookings multiply the Sales Target by the percentage of new bookings to be sourced by marketing:
50% * $10M = $5M
Step Two
Wins
How Many Wins Need to be Sourced by Marketing?
Next, you will want to determine the number of wins that will need to come from marketing-sourced leads. In other words, how many deals sourced by marketing need to close to hit the $5M target (calculated in step one)?
This calculation is relatively straightforward if you can estimate the Average Selling Price (ASP). You can divide the Marketing Sourced Bookings target from step one by the ASP.

Average Selling Price (ASP)
Start by reviewing the historical trends for ASP in your deals over the past 6, 12 and 18.
- What is the ASP for closed/won deals? Has it remained consistent? Or is it trending upwards or down over time?
- What is the ASP for deals in the current sales pipeline that are not yet closed? Are they larger or smaller than the historical average?
- Are there any big deals in the pipeline or closed/won deals? If so, are these outliers that are skewing the ASP to appear higher than it normally would be?
Review Planning Assumptions
Next review your strategic planning assumptions about the upcoming year and how each of the following factors might impact ASP.
Note: Most companies skip this step and wonder why their plan doesn’t match actual results
- Are you changing pricing or packaging?
- Are you introducing new products?
- Is your sales compensation plan changing?
- Is the level of competition increasing or decreasing?
- What else might impact average deal size increasing or decreasing?
Example – How Many Wins Need to be Sourced by Marketing?
Suppose that the ASP over the past 18 months has been in the $30-$40K ACV range. However, deals in the current pipeline are trending in the $45-$60K range. The sales organization is hiring more enterprise reps to chase bigger deals in the coming year. In addition, the product management team is planning to release an enhanced version of your company’s flagship product with a few highly differentiated features that the competition does not offer. As a result, the marketing team assumes that ASP will increase by 20% on average to $50K.
To calculate the number of wins required, we divide the marketing-sourced bookings target by ASP:
$5M / $50K = 100 Wins
Step Three
Opportunities
How Many Opportunities Need to be Sourced by Marketing?
Opportunity-to-Win Ratio
Third, you will need to determine how many opportunities need to be sourced by marketing in order to generate the 100 wins (calculated in step two). The key to the performing the calculation is understanding the win ratio. How many of the opportunities that enter your sales pipeline typically convert into closed/won deals?

Review Historical Trends
Start by reviewing historical conversion rates over the past 6, 12, and 18 months from your CRM system.
- What percentage of early-stage opportunities convert into wins?
- Has the win rate percentage changed over time?
- Does the percentage of opportunities converting into wins vary significantly depending upon the lead source?
- Are marketing-sourced opportunities as likely to close as sales-sourced opportunities?
Review Planning Assumptions
Next review your strategic planning assumptions about the upcoming year. Will these drive your win rate up or down?
Note: Most companies skip this step and wonder why their plan doesn’t match actual results
- How fast are you trying to grow? With overall industry CAGR? Or at above-market rates?
- What are the competitive dynamics? Is the level of competition increasing or decreasing?
- What are the market dynamics? Is it a buyer’s market or a seller’s market?
- What is happening to lost opportunities? Are deals resulting in “no decision” outcomes? Or are the competitors winning?
- Is the criteria for an opportunity to enter the sales pipeline changing? If so, to be more rigorous or less?
Example – How Many Opportunities Need to be Sourced by Marketing
Suppose that over the past 18 months that 30% of opportunities entering the sales pipeline have resulted in wins. However, a new wave of market entrants has emerged who are aggressively competing for business. A review of recent wins and losses over the past six months indicates that buyers are feeling more power and demanding more contractual commitments from vendors. Deals are requiring additional security audits, tighter contractual commitments, and future product roadmap commitments. As a result, the marketing team believes that conversion rates for sales pipeline opportunities are likely to decrease in the coming year to 20%.
To calculate the number of opportunities required to meet the sales plan, divide the number of marketing-sourced wins by the projected opportunity-to-win conversion rate.
100 Wins / 20% = 500 Opportunities
Step Four
Leads
How Many Leads Need to be Sourced by Marketing?
Lead-to-Opportunity Conversion Rate
Finally, you will need to determine how many leads will need to be sourced by marketing in order to yield the 500 opportunities (calculated in step three). To determine lead target you will need to understand the historical lead-to-opportunity conversion rates.

Lead Conversion Rates – Review Historical Trends
Start by reviewing historical conversion rates over the past 6, 12, and 18 months from your CRM system.
- What percentage of leads are converting into opportunities?
- Does the conversion rate vary by the types of campaigns used?
- Does the conversion rate vary by product, customer size, or channel?
- Has the lead conversion rate increased or decreased over time?
Review Planning Assumptions
Next review your planning assumptions for the upcoming year. Will these drive lead conversion rates up or down?
Note: Most companies skip this step and wonder why their plan doesn’t match actual results
- Are you changing the mix of marketing programs used to source leads? Will you be experimenting with new types of programs?
- Are you changing the definition or scoring algorithms used to qualify leads?
- Are you hiring new SDRs? Are you hiring new marketing campaign managers? How long will they take to learn the business?
- Are you implementing an ABM program that may result in fewer leads with larger deal sizes?
Example – How Many Leads Need to be Sourced by Marketing
Suppose that the historical lead-to-opportunity conversion rate has been 50%. However, the majority of leads historically have been generated through SDR prospecting activities. Going forward, the business is seeking to generate more leads through digital programs such as online advertising, search engines, webinars, email, and content marketing programs. As a result, the conversion rates for marketing leads are expected to decrease from 50% to 33% in the coming year.
To calculate the number of leads required to meet the sales plan, divide the number of opportunities (calculated in step three) by the lead-to-opportunity conversion rate.
500 Opportunities / 33% = 1500 Leads
You can continue to work backwards up the marketing funnel to determine the appropriate number of Marketing Accepted Leads (MALs) and inquiries generated by each of your different marketing campaigns and channels.
Step Five
Inquiries
How Many Inquiries Need to be Sourced by Marketing?
Lead-to-Opportunity Conversion Rate
You can continue working backwards up the marketing funnel to determine the appropriate number of Marketing Accepted Leads (MALs) and inquiries generated by your different marketing campaigns and channels.