
Reporting on CAC Payback Benchmarks
CAC Payback benchmarks are published by various organizations to help both investors and finance teams at SaaS companies understand how their GTM efficiency compares to that of similar organizations. The most efficient SaaS and cloud companies recover customer acquisition costs in under 12 months. However, the average CAC Payback for SaaS companies is between 20 and 30 months. Early-stage startups and less efficient companies can take between 36 and 48 months to pay back customer acquisition costs.
The payback periods for publicly traded SaaS companies can be determined by analyzing the income statements published in their investor filings. Private companies do not publish their financial statements. Instead, survey data is collected from finance teams periodically and aggregated into reports shared with the general public. These surveys and benchmarks are published by venture capital firms and influencers that follow the SaaS finance space.
- Bessemer Venture Partners – Private companies by ARR range
- Keybanc/Sapphire Ventures – Private SaaS trended over time
- HighAlpha – Private SaaS by ARR range
- Iconiq Capital – Public and private companies trended over time
- Meritech Capital – Public SaaS companies trended over time

The Venture Capital Firms Who Publish CAC Payback Benchmarks
The benchmarks are presented in two different formats:
- Trends over time – How the overall population of SaaS companies’ CAC payback periods has changed between 2020 and 2025
- ARR segments – The median or average payback period for SaaS companies within a specific revenue range (e.g., $10-$25M ARR)
The publishers of the benchmarks use different formulas to calculate the payback periods. One of the primary differences is the scope:
- New Logo Only – Includes only ARR from new logo customer acquisition and the associated percentage of sales and marketing costs.
- New + Expansion – Includes both new and expansion revenue along with the fully burdened sales, marketing, and customer success costs.
BVP Benchmarks
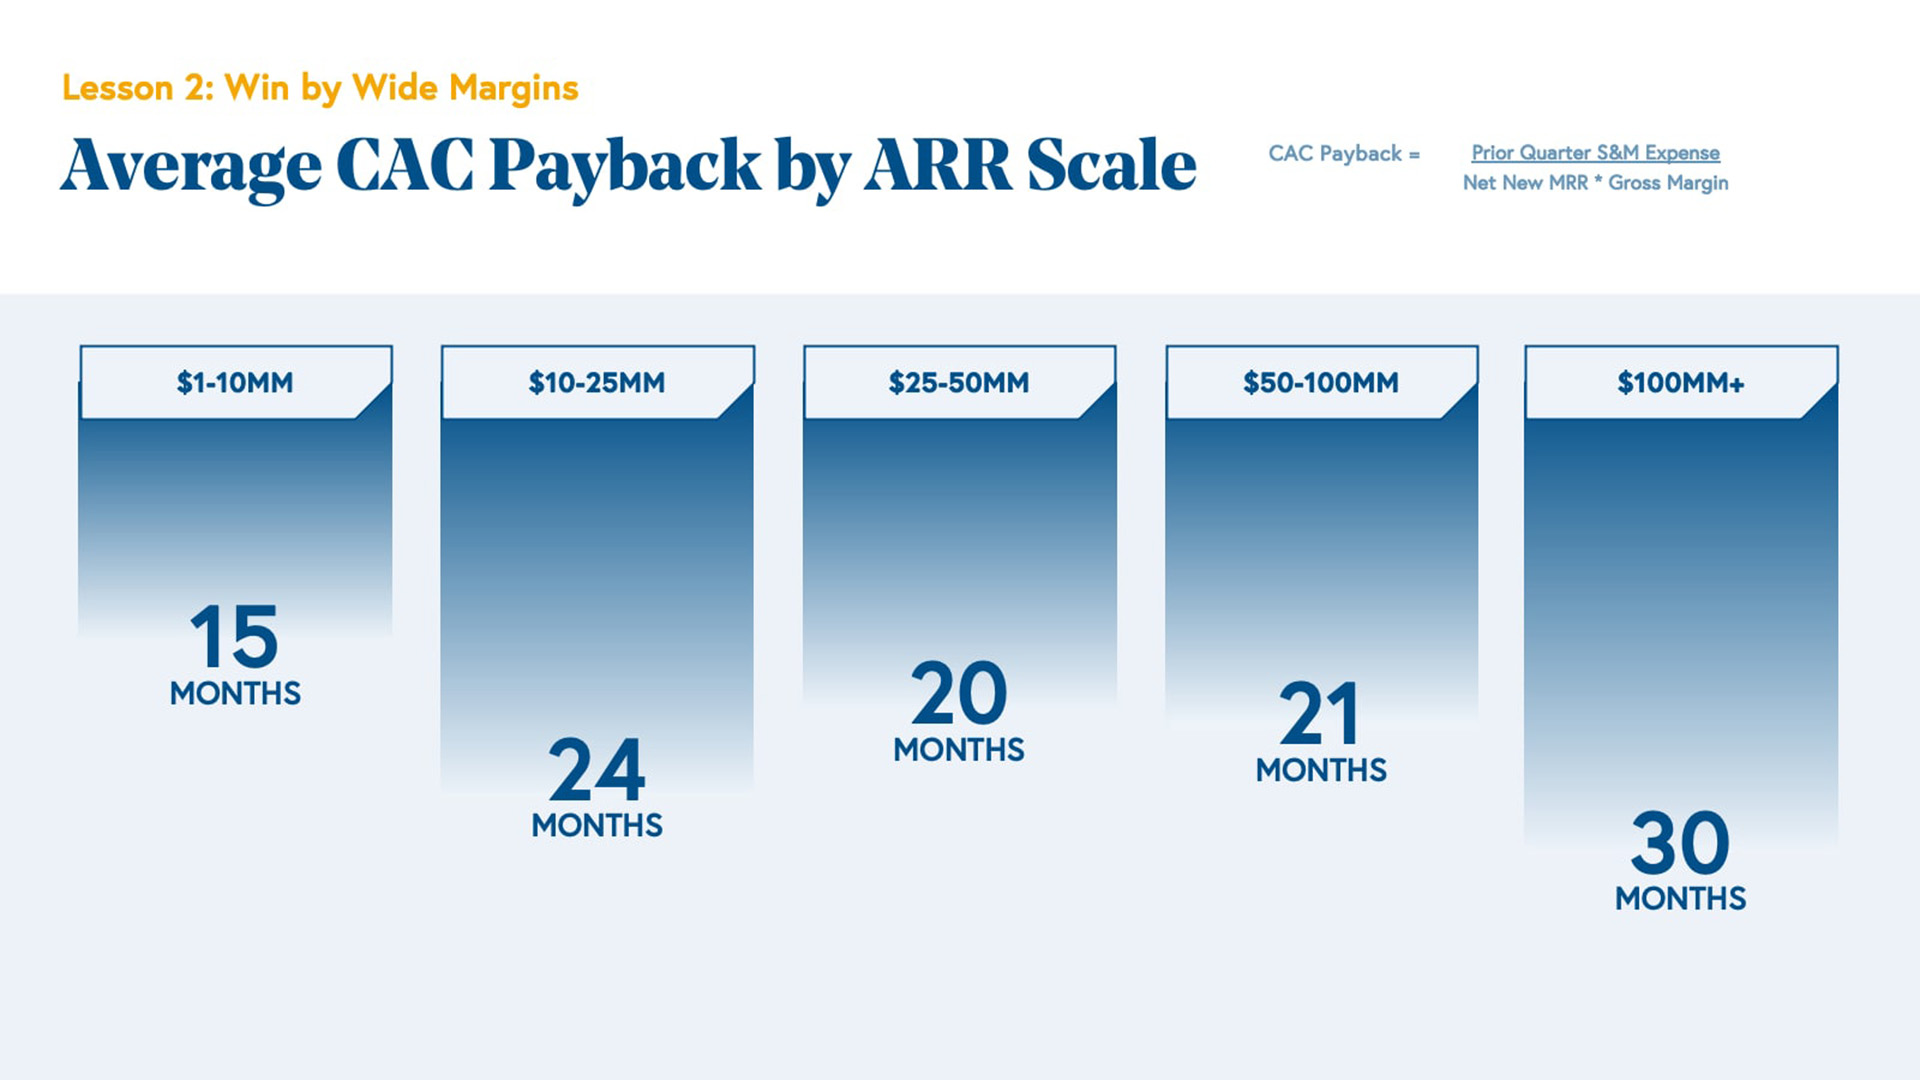
BVP does not publish regular benchmarks on CAC payback periods, but it does maintain an online library of resources for SaaS metrics that is regularly updated. In BVP’s Guide to Scaling to $100M, the firm shares the average benchmarks by ARR range.
CAC Payback for Enterprise versus SMB
BVP explains that SaaS companies selling to enterprise accounts can afford longer payback periods because there is less churn, and larger customers generate more lifetime value. Those selling to SMBs, however, need shorter payback periods because they have a higher average churn rate and lower lifetime value. BVP’s guidance on CAC payback periods is:
- SMB-focused – Target less than 12 months
- Mid-market – Target less than 18 months
- Enterprise – Target less than 24 months
Note that BVP defines CAC Payback as Prior Quarter Sales & Marketing Expense divided by the product of Net New MRR and Gross Margin.
KeyBanc/Sapphire Ventures Benchmarks
KeyBanc Capital Markets partners with Sapphire Ventures to publish an annual set of benchmarks on the SaaS metrics of private companies. The 2024 survey had over 100 respondents from a mix of private equity, venture capital, and independent companies. Survey respondents represented a diverse mix of SaaS subsegments, including horizontal SaaS, vertical SaaS, and fintech.
CAC Payback Trends over Time
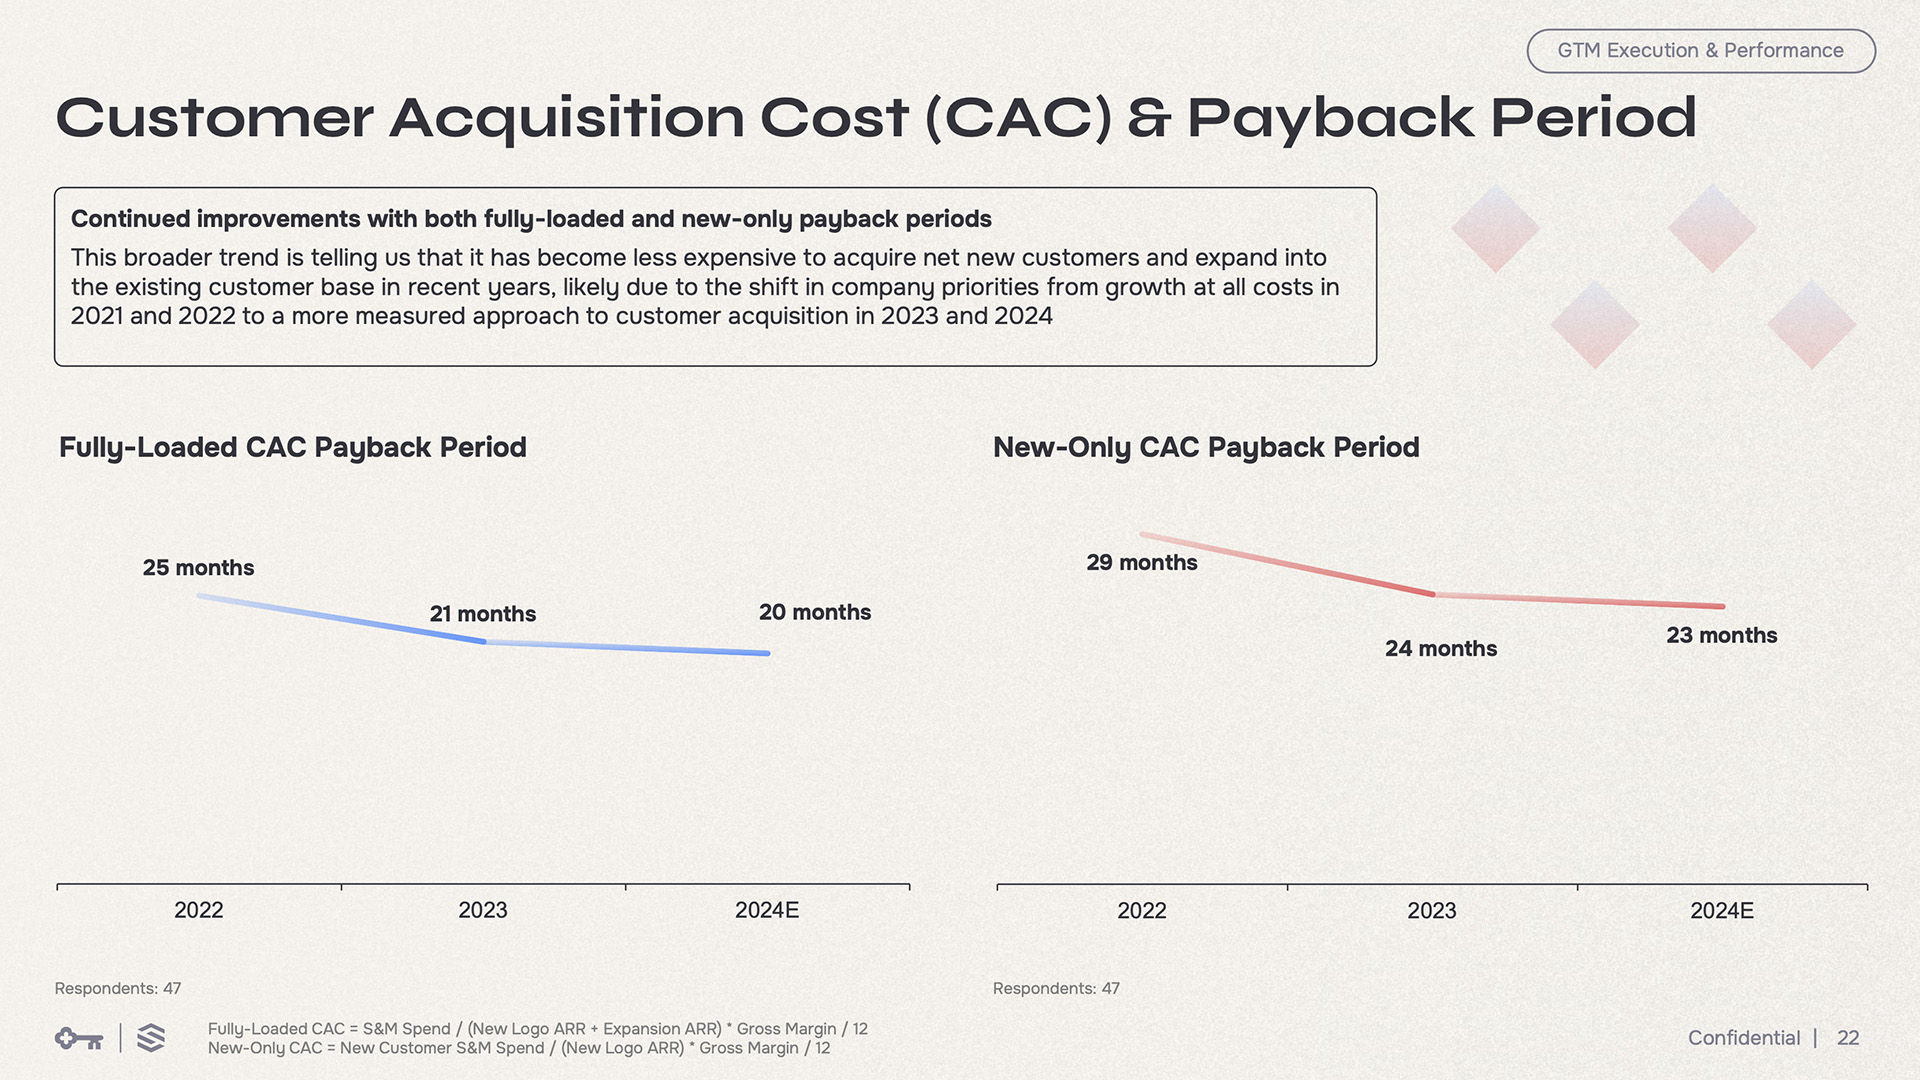
The 2024 survey showed how the CAC payback period has trended over the past three years. Companies have become more efficient in sales and marketing over this time period, with the payback period dropping by several months each year.
Fully-Loaded vs New CAC Payback
The 2024 data shows benchmarks for “Fully-loaded CAC” (new logo and expansion) and “New-only CAC” (new logo only).
The prior year’s survey data from 2023 showed CAC payback period benchmarks by ARR range. For each revenue range, a median, top quartile, and bottom quartile benchmark are provided.
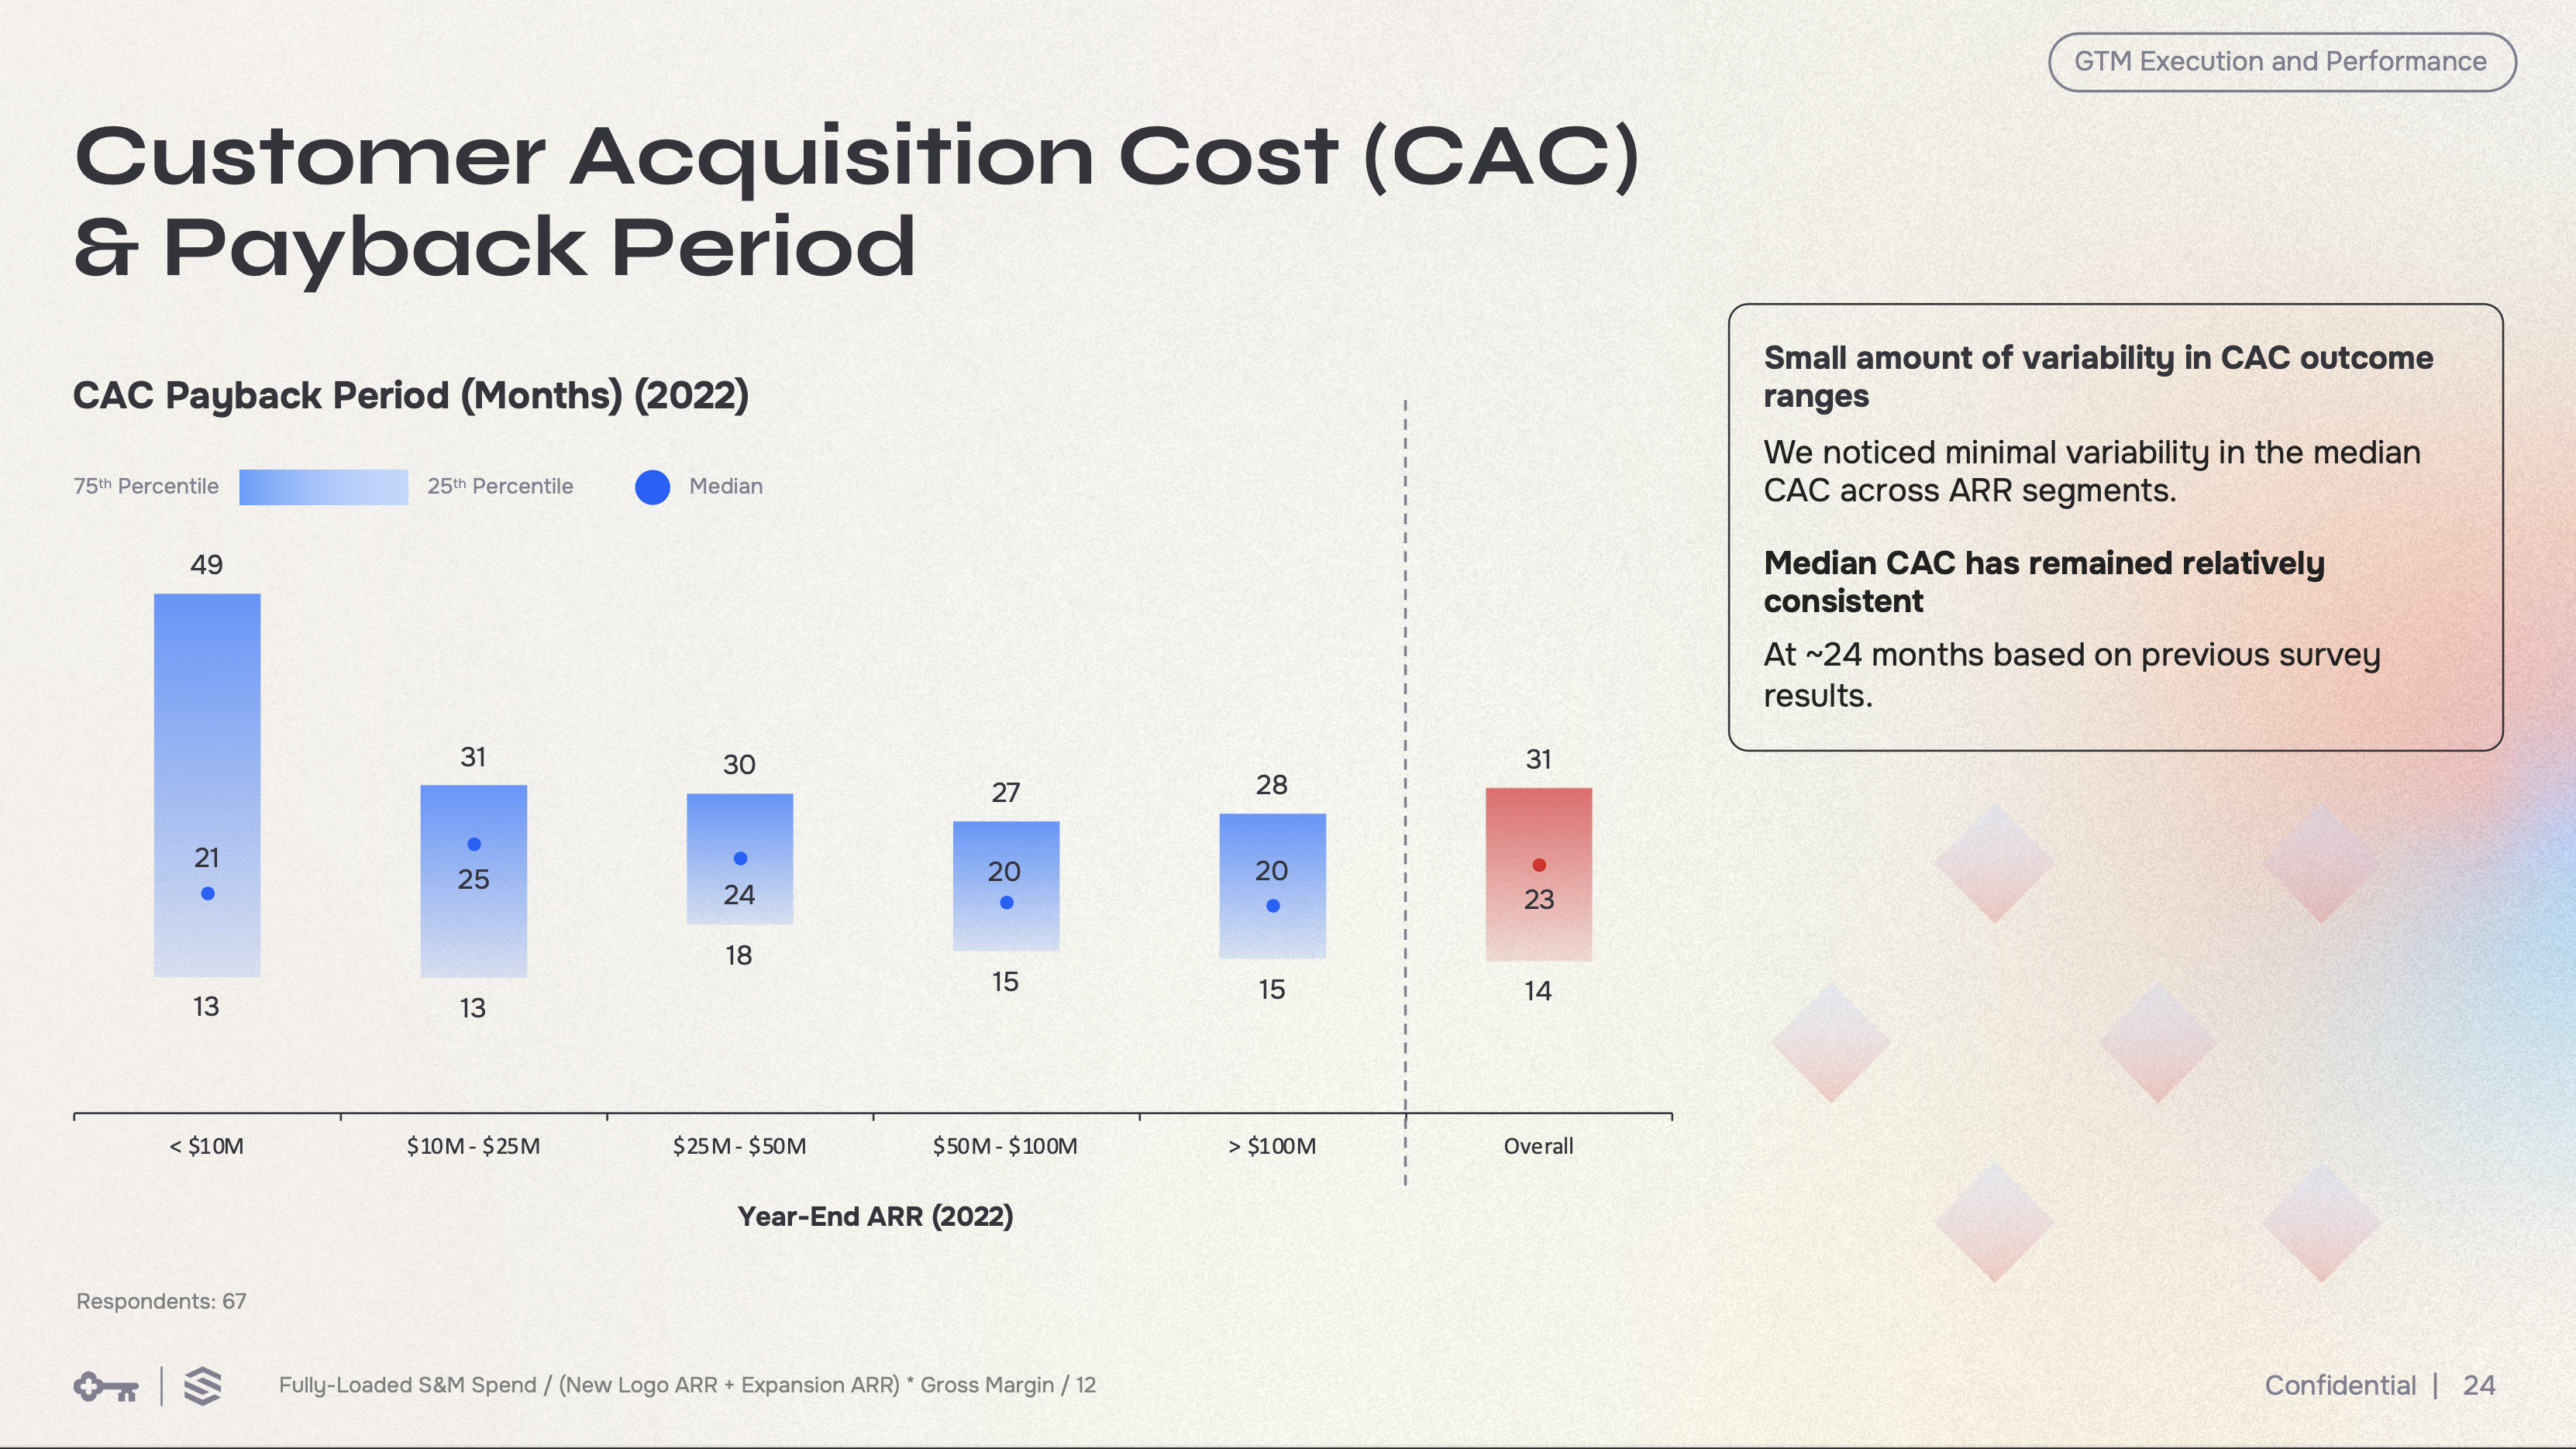
The range of CAC payback periods varies dramatically for smaller companies, from about a year to just over four years. The payback periods converge to a much tighter range after companies surpass $10M in ARR. Also noteworthy is that the median payback period remains relatively flat across the range of revenue levels.
High Alpha Benchmarks
High Alpha partners with OpenView, Paddle, and Tremont to publish an annual set of SaaS metrics benchmarks. The 2024 study collected data from over 800 SaaS companies on dozens of different metrics including CAC payback periods.
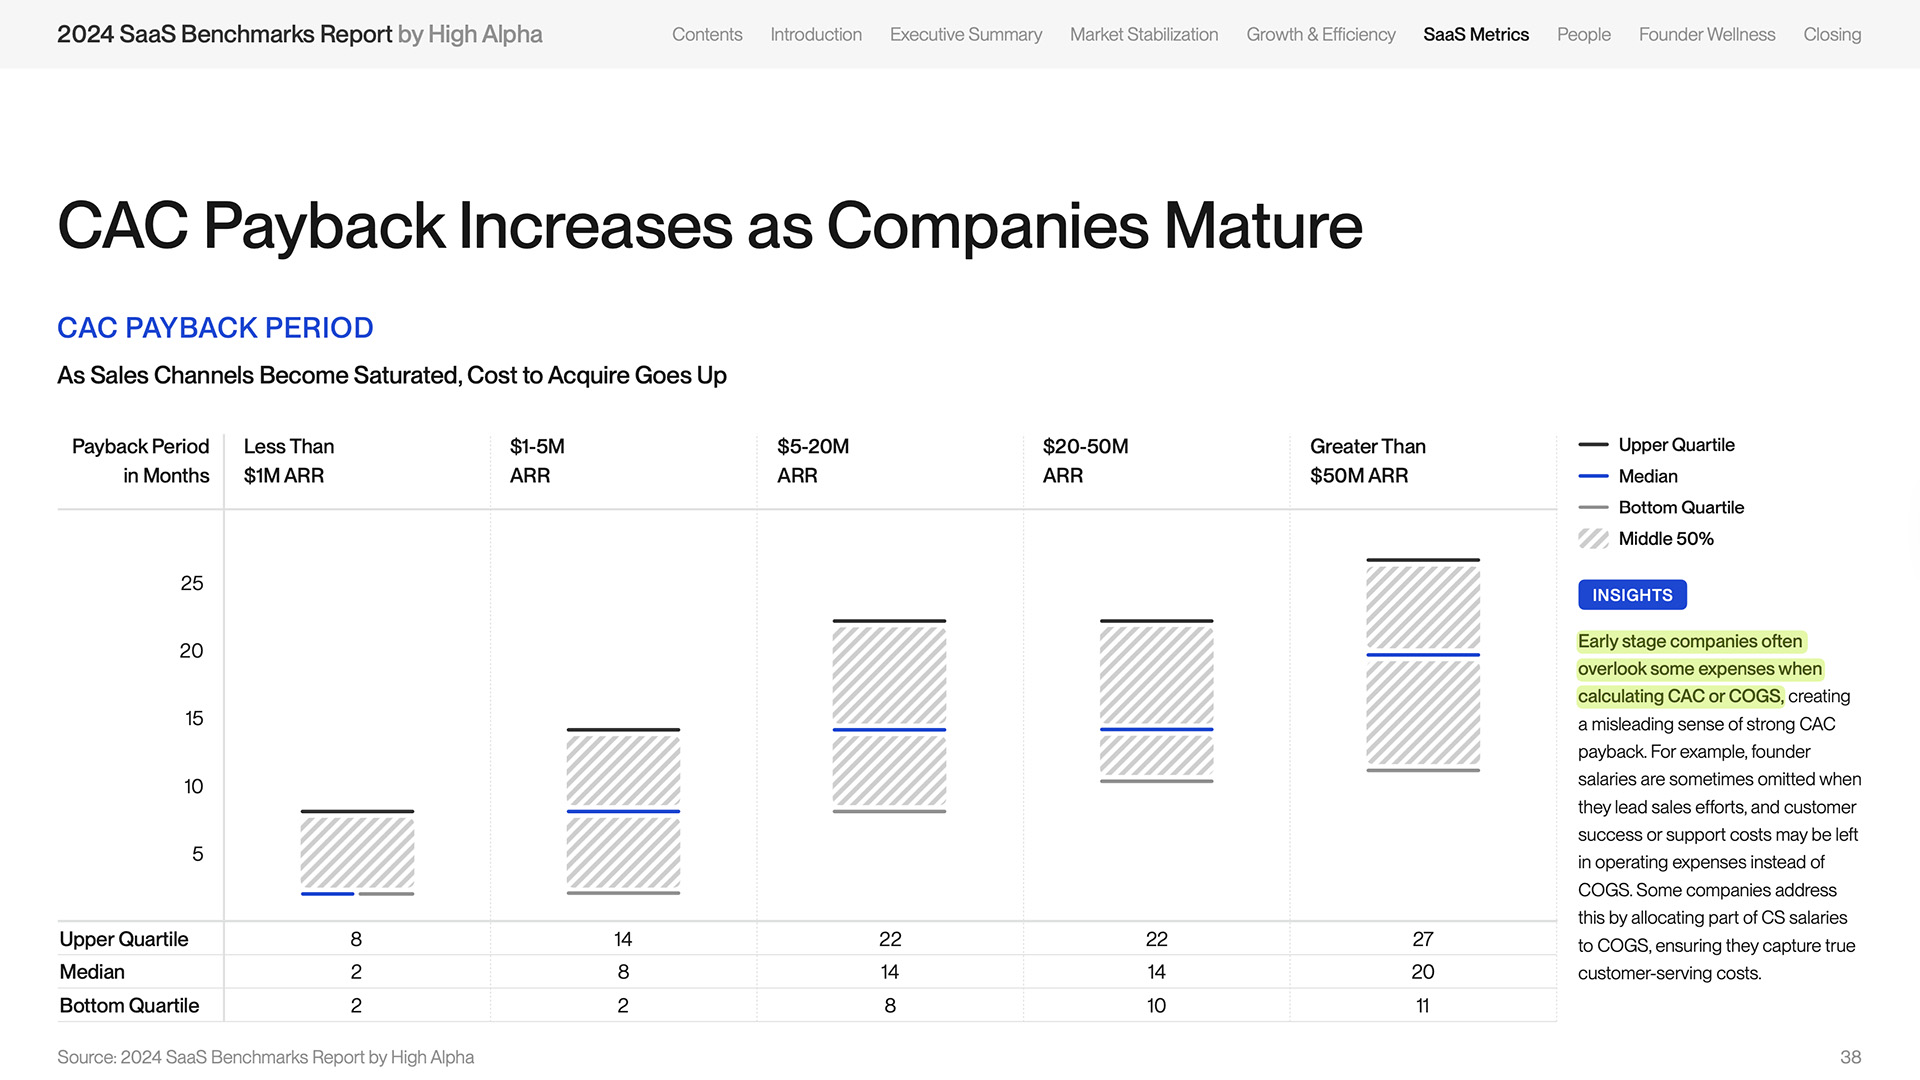
In the chart below, High Alpha groups CAC payback benchmarks by ARR range. The median, top quartile, and bottom quartile are shown for each revenue range.
CAC Payback Benchmarks by ARR Range
The High Alpha data shows that the payback period increases as companies scale. The report notes the theory that as sales channels become saturated, the cost of acquiring additional revenue increases. The median payback period for an early-stage company with less than $1M in ARR is only 2 months. The time to recover sales and marketing costs for a company with $50M+ ARR is 10 times as long – 20 months. High Alpha does not provide a formula for how the calculation was performed.
ICONIQ Benchmarks
ICONIQ reported on CAC payback benchmarks in its 2023 New Era of Efficient Growth report. Metrics were captured from almost 100 B2B SaaS providers, including ICONIQ’s portfolio and a dozen publicly traded companies. Survey respondents included a diverse mix of sectors, such as operations and GTM, infrastructure and security, consumer, and fintech.
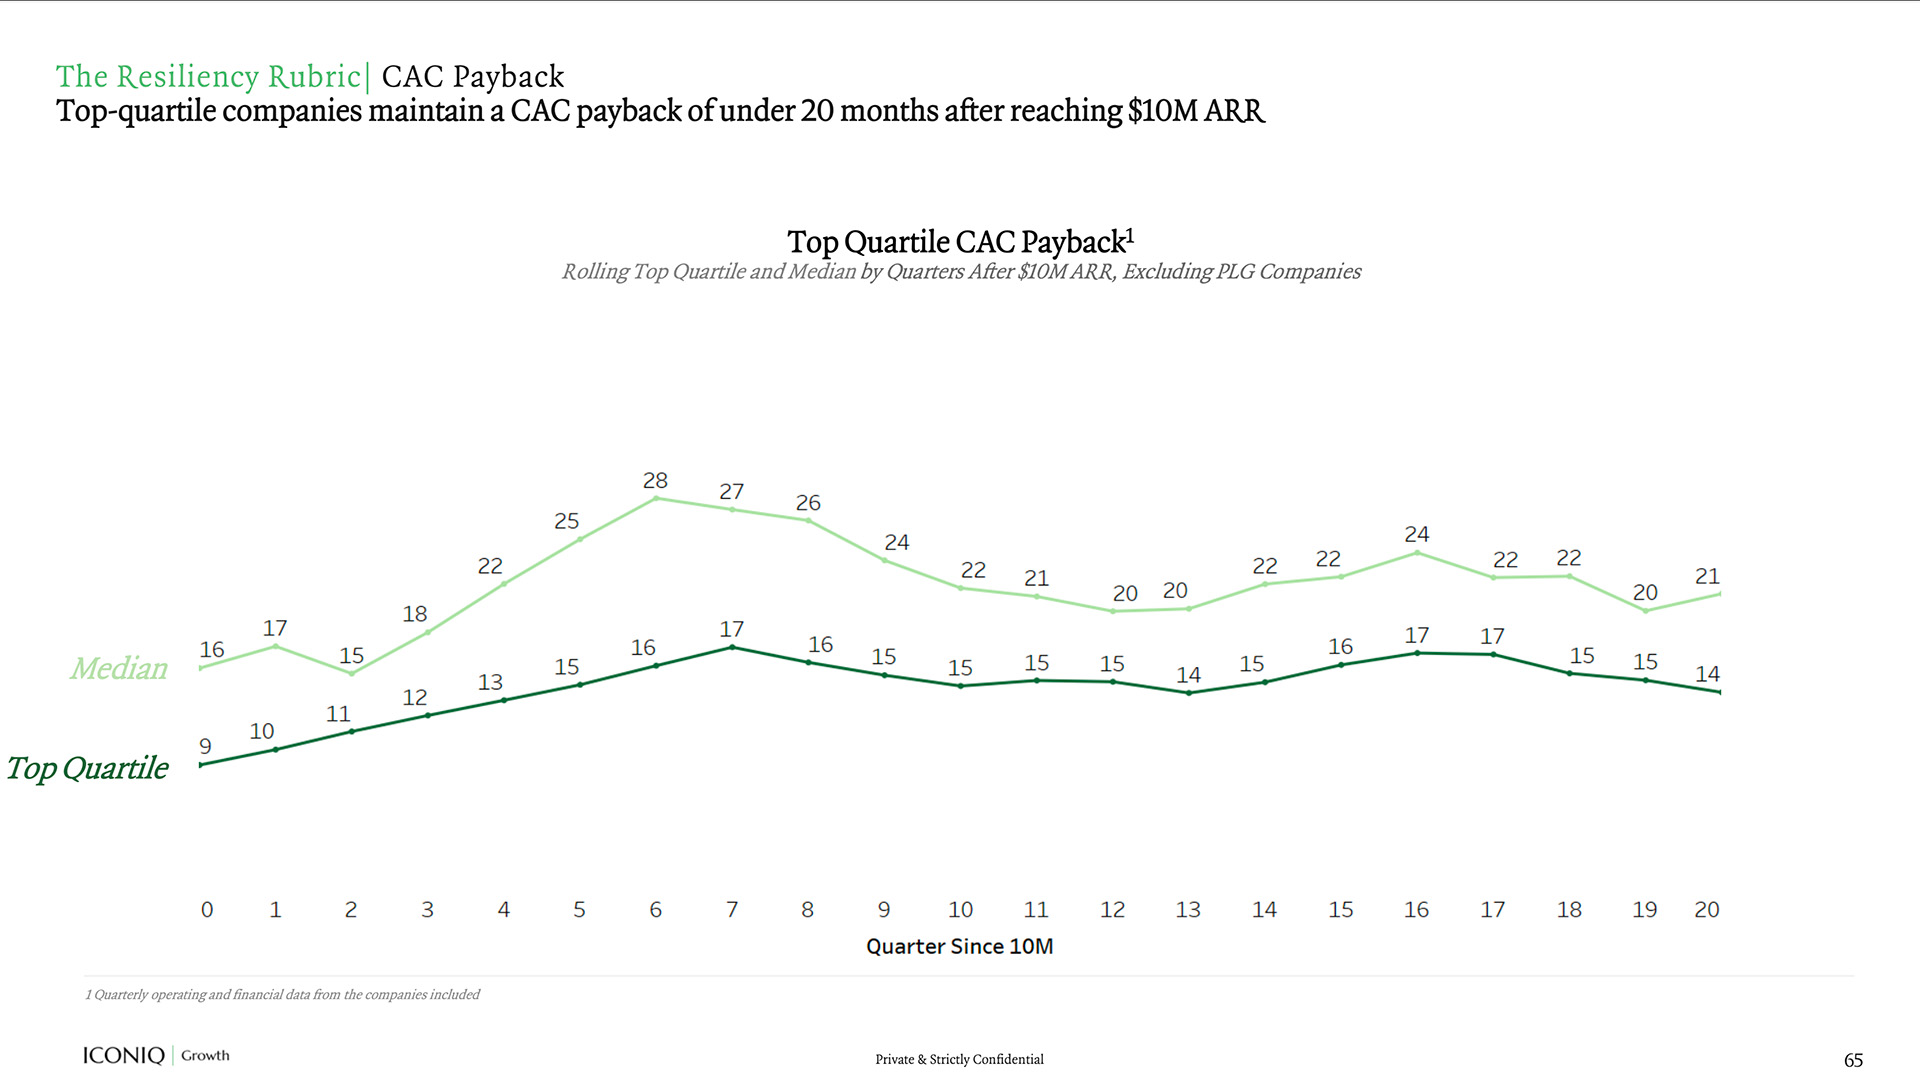
CAC Payback Period Trends over Time
Iconiq’s data shows how the payback period length has changed over the 2020-2023 timeframe. SaaS companies took less time to recover sales and marketing costs during the pandemic, but as interest rates rose, the payback period increased sharply to 30 months.
Meritech Capital Benchmarks
Meritech publishes a monthly set of benchmarks for all publicly traded SaaS and cloud companies. Meritech sources all its data from investor filings, such as SEC 10-K and 10-Q reports.
Median CAC Payback Period Trends over Time
Meritech presents a quarterly trend line for the CAC payback period over the past five years. There was a significant drop in the time it took to recover sales and marketing costs during the pandemic, with a low point in Q2 2021.
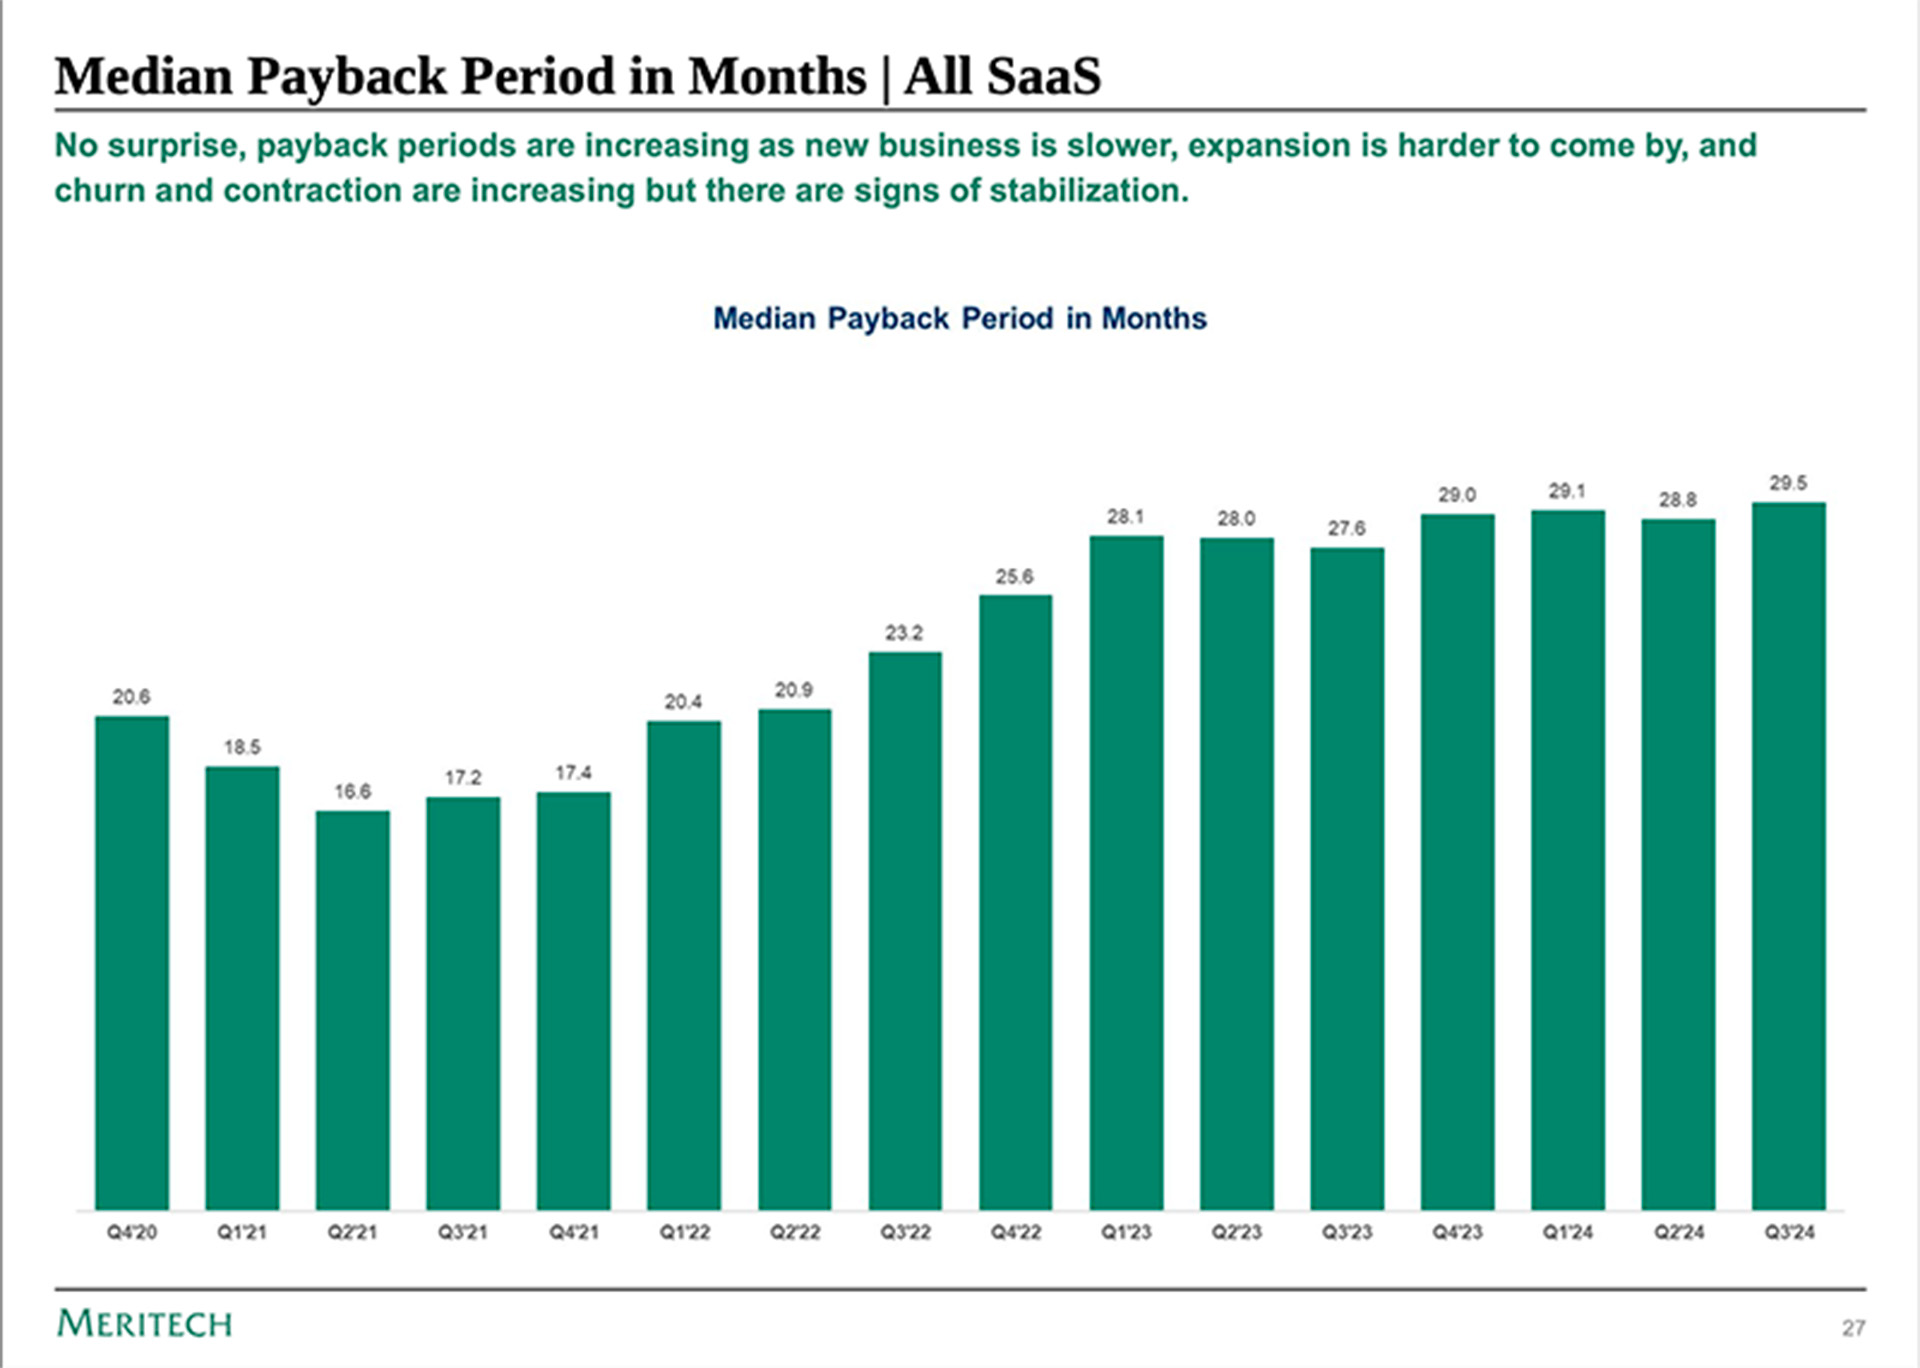
However, as interest rates rose and buyers cut back on spending in 2022, there was a sharp increase. The average payback periods started to level off in 2023 and continued to increase slightly in 2024.